Orthorectification
The HyperGas class Ortho supports geocoding (orthorectifying) datasets,
resampling and reorienting them to the Universal Transverse Mercator (UTM) coordinate system,
which is useful for the subsequent emission quantification.
EMIT
As described in the EMIT tutorial, users can get the geometric lookup table (GLT) from Level 1 data and apply orthorectification easily.
>>> from hypergas.orthorectification import Ortho

>>> ch4_ortho = Ortho(hyp.scene, varname='ch4').apply_ortho()

>>> print(ch4_ortho)

<xarray.DataArray 'ch4' (bands: 1, y: 1959, x: 1783)> Size: 14MB
array([[[nan, nan, nan, ..., nan, nan, nan],
        [nan, nan, nan, ..., nan, nan, nan],
        [nan, nan, nan, ..., nan, nan, nan],
        ...,
        [nan, nan, nan, ..., nan, nan, nan],
        [nan, nan, nan, ..., nan, nan, nan],
        [nan, nan, nan, ..., nan, nan, nan]]], dtype=float32)
Coordinates:
* y        (y) float64 16kB 4.496e+06 4.496e+06 ... 4.376e+06 4.376e+06
* x        (x) float64 14kB 3.396e+05 3.396e+05 ... 4.491e+05 4.492e+05
Dimensions without coordinates: bands
Attributes: (12/22)
    long_name:            methane_enhancement
    units:                ppb
    name:                 ch4
    file_type:            ['emit_l1b_rad']
    standard_name:        methane_enhancement
    nc_group:             None
    ...                   ...
    _satpy_id:            DataID(name='ch4', modifiers=())
    ancillary_variables:  []
    sza:                  30.461334228515625
    vza:                  9.43835163116455
    description:          methane enhancement derived by the 2110~2450 nm win...
    matched_filter:       normal matched filter
Projection and extent information are stored in the area attribute, which is an instance of AreaDefinition.
The get_lonlats() method can be used to get longitude and latitude coordinates:
>>> print(ch4_ortho.attrs['area'])

Area ID: EMIT_utm
Description: EMIT_utm
Projection: {'datum': 'WGS84', 'no_defs': 'None', 'proj': 'utm', 'type': 'crs', 'units': 'm', 'zone': '39'}
Number of columns: 1783
Number of rows: 1959
Area extent: (339550.4912, 4376026.134, 449198.9706, 4496498.0191)

>>> lons, lats = ch4_ortho.attrs['area'].get_lonlats()
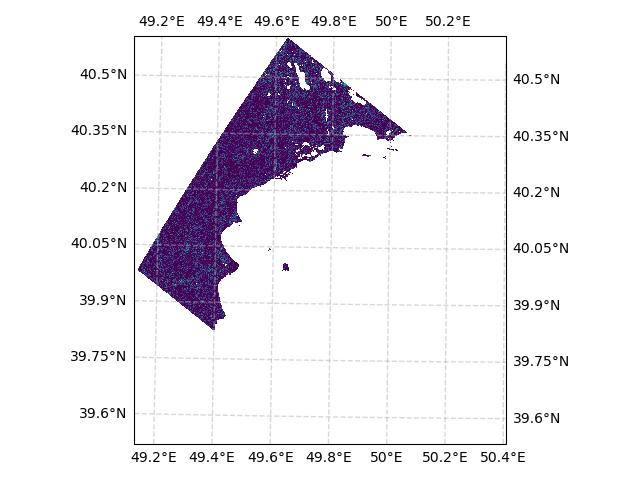
Users can also plot the data directly using the projection info:
>>> import cartopy.crs as ccrs

>>> # get the landmask
>>> segmentation_ortho = Ortho(hyp.scene, varname='segmentation').apply_ortho()

>>> crs = ch4_ortho.attrs['area'].to_cartopy_crs()
>>> fig, ax = plt.subplots(subplot_kw={'projection': crs})

>>> ax.gridlines(crs=ccrs.PlateCarree(), draw_labels=True, linewidth=1, alpha=0.5, linestyle='--')
>>> plt.imshow(ch4_ortho_emit.squeeze().where(segmentation_ortho>0),
...            transform=crs, extent=crs.bounds,
...            origin='upper', vmin=0, vmax=200,
...            interpolation='none',
...            )
EnMAP
The EnMAP L1 data provides Rational Polynomial Coefficients (RPCs), which can be read
using rasterio.
The Ortho class reads RPCs and downloads Digital Elevation Model (DEM) data using
dem-stitcher.
The primary DEM source is the 30-m SRTM V3 dataset.
If SRTM V3 is unavailable, HyperGas falls back to the 30-m Copernicus GLO-30 dataset.
>>> # the RPCs are different for different wavelengths, since the retrieval window is narrow, we use the mean wavelength for orthorectification

>>> mean_wvl = (2110+2450)/2
>>> rpcs = hyp.scene['rpc_coef_swir'].sel(bands_swir=mean_wvl, method='nearest').item()
>>> ch4_ortho = Ortho(hyp.scene, varname='ch4', rpcs=rpcs).apply_ortho()

>>> print(ch4_ortho)

<xarray.DataArray 'ch4' (bands: 1, y: 1016, x: 1347)> Size: 11MB
array([[[nan, nan, nan, ..., nan, nan, nan],
        [nan, nan, nan, ..., nan, nan, nan],
        [nan, nan, nan, ..., nan, nan, nan],
        ...,
        [nan, nan, nan, ..., nan, nan, nan],
        [nan, nan, nan, ..., nan, nan, nan],
        [nan, nan, nan, ..., nan, nan, nan]]])
Coordinates:
* y        (y) float64 8kB 2.564e+06 2.564e+06 ... 2.528e+06 2.528e+06
* x        (x) float64 11kB 2.266e+05 2.267e+05 ... 2.742e+05 2.743e+05
Dimensions without coordinates: bands
Attributes: (12/24)
    units:                ppb
    time:                 2024-01-23 06:08:16.394298
    vza:                  29.7906989445
    vaa:                  12.1493558221
    sza:                  46.142672
    saa:                  155.817704
    ...                   ...
    _satpy_id:            DataID(name='ch4', modifiers=())
    ancillary_variables:  []
    standard_name:        methane_enhancement
    long_name:            methane_enhancement
    description:          methane enhancement derived by the 2110~2450 nm win...
    matched_filter:       normal matched filter
PRISMA
Since PRISMA L1 data does not include orthorectification information, users need to use external tools like QGIS to generate Ground Control Points (GCPs) for manual orthorectification.
>>> import pandas as pd
>>> from rasterio.crs import CRS

>>> gcp_file = glob(data_dir_prisma + '*points')[0]

>>> with open(gcp_file, 'r') as f:
...    first_line = f.readline()
...    wkt = first_line[len('#CRS:'):].strip()
...    gcp_crs = CRS.from_wkt(wkt).to_epsg()

>>> gcps = pd.read_csv(gcp_file, delimiter=',', comment='#', header=0)

>>> ch4_ortho = Ortho(hyp.scene, varname='ch4', gcps=gcps, gcp_crs=gcp_crs).apply_ortho()
hypergas.orthorectification - INFO: Orthorectify ch4 using gcp

>>> print(ch4_ortho)

<xarray.DataArray 'ch4' (bands: 1, y: 1152, x: 1225)> Size: 11MB
array([[[nan, nan, nan, ..., nan, nan, nan],
        [nan, nan, nan, ..., nan, nan, nan],
        [nan, nan, nan, ..., nan, nan, nan],
        ...,
        [nan, nan, nan, ..., nan, nan, nan],
        [nan, nan, nan, ..., nan, nan, nan],
        [nan, nan, nan, ..., nan, nan, nan]]])
Coordinates:
* y        (y) float64 9kB 2.562e+06 2.562e+06 ... 2.526e+06 2.526e+06
* x        (x) float64 10kB 2.311e+05 2.311e+05 ... 2.696e+05 2.696e+05
Dimensions without coordinates: bands
Attributes: (12/20)
    units:                ppb
    area:                 Area ID: hyc_utm\nDescription: hyc_utm\nProjection:...
    sza:                  46.043415
    saa:                  146.47206
    filename:             /home/xinz/Documents/githab/HyperGas-GMD/data/ch4_c...
    sensor:               hyc
    ...                   ...
    vza:                  18.37160715623088
    vaa:                  96.93992563581872
    standard_name:        methane_enhancement
    long_name:            methane_enhancement
    description:          methane enhancement derived by the 2110~2450 nm win...
    matched_filter:       normal matched filter
If GCPs are unavailable, users can still carry out plume detection and quantification workflows; however, they should be aware that the geographic positioning may have spatial offsets of up to 200 meters without proper orthorectification.
>>> ch4_ortho = Ortho(hyp.scene, varname='ch4').apply_ortho()
hypergas.orthorectification - INFO: `rpc` or `glt` is missing. Please check the accuracy of orthorectification manually.

>>> print(ch4_ortho)

<xarray.DataArray 'ch4' (bands: 1, y: 1152, x: 1225)> Size: 11MB
array([[[nan, nan, nan, ..., nan, nan, nan],
        [nan, nan, nan, ..., nan, nan, nan],
        [nan, nan, nan, ..., nan, nan, nan],
        ...,
        [nan, nan, nan, ..., nan, nan, nan],
        [nan, nan, nan, ..., nan, nan, nan],
        [nan, nan, nan, ..., nan, nan, nan]]])
Coordinates:
* y        (y) float64 9kB 2.562e+06 2.562e+06 ... 2.526e+06 2.526e+06
* x        (x) float64 10kB 2.311e+05 2.311e+05 ... 2.696e+05 2.696e+05
Dimensions without coordinates: bands
Attributes: (12/20)
    units:                ppb
    area:                 Area ID: hyc_utm\nDescription: hyc_utm\nProjection:...
    sza:                  46.043415
    saa:                  146.47206
    filename:             /home/xinz/Documents/githab/HyperGas-GMD/data/ch4_c...
    sensor:               hyc
    ...                   ...
    vza:                  18.37160715623088
    vaa:                  96.93992563581872
    standard_name:        methane_enhancement
    long_name:            methane_enhancement
    description:          methane enhancement derived by the 2110~2450 nm win...
    matched_filter:       normal matched filter